How to Find the Optimal Configuration for Your Virtualized Environment

December 16, 2015

Thanks to the New York Oracle User Group for allowing me to present and to all who attended for their valuable questions and comments.
The presentation showcases a framework for finding optimal server configurations that can be useful to anyone who is dealing with sever consolidation. Those working with Oracle Enterprise Manager/Grid Control can get some practical tips as well.

The PDF version of the presentation is here.
The Power Point version of the presentation is here. Many PowerPoint slides have notes.


Importance of Data Clustering when Deleting in Batches

July 27, 2015

The inspiration for this post comes from  the OTN discussion “Bulk Deletes from a Large Table”  where I volunteered the idea that we can improve the performance by taking into the account the clustering of the data to be deleted. Since my statement was rather general, I decided to create this post to fill in all the details.

First, we start with the table definition:

CREATE TABLE test
(
dt DATE ,
st NUMBER ,
other_num NUMBER ,
other_str VARCHAR(100)
)

The the first column of the table is a DATE, the second one status – a number between 0 and 100.

We want to populate the table with test data with special data clustering characteristics. We want to simulate the data distribution (clustering) we would get if users insert data in chronological order – i.e. the older data (the smallest dt value) gets inserted first, then slightly newer data, and so forth.
The following code fragment will not only fill the table with data, but it will also get us the desired data clustering.

BEGIN
  FOR i IN 1..200
  LOOP
    INSERT INTO test
  WITH v1 AS
    (SELECT rownum n FROM dual CONNECT BY level <= 10000
    )
  SELECT trunc(sysdate - i ),
    mod(rownum , 100) ,
    rownum ,
    'BLAHBLAH123'
  FROM v1,
    v1
  WHERE rownum <= 5000;
  COMMIT;
END LOOP;
END;
/

The data in the TEST table is clustered by DT. Records with the same DT are likely to be in the same block. That cannot be said for records with the same ST. Those records are scattered all over the table.

Now, let’s create indexes that would support equally well each of the purge methods and gather stats:

CREATE INDEX idx1 ON test
  (dt , st
  )
CREATE INDEX idx2 ON test
  (
    st ,
    dt
  )
  EXEC dbms_stats.gather_table_stats
  (
    '??????',
    'TEST'
  )

To better simulate memory pressure, let create a procedure that would flush the shared pool.
As SYS:

CREATE
PROCEDURE flush_bc
AS
BEGIN
  EXECUTE immediate 'alter system flush buffer_cache';
END;
/
GRANT EXECUTE ON flush_bc TO ??????;

The first purge technique accesses the data via DT. Since the data is clustered on DT, it is expected this technique to be faster.

BEGIN
  FOR i IN 100..200
  LOOP
    DELETE TEST WHERE DT BETWEEN TRUNC(SYSDATE - i ) AND TRUNC(SYSDATE - i +1 ) ;
    COMMIT;
    sys.flush_bc ;
  END LOOP;
END;
/ 

It takes 20263 physical reads.

The second one (please rebuild the TEST table before retrying) accesses the data via ST. The data for a ST is spread across many blocks, so this technique is expected to be slower.

BEGIN
  FOR i IN 0..101
  LOOP
    DELETE TEST WHERE ST = i AND DT < TRUNC(SYSDATE - 98 ) ;
    COMMIT;
    sys.flush_bc;
  END LOOP;
END;
/

took 239100 physical reads – more than 10 times the first one.

This test clearly shows that the first technique is better than the second one. The memory pressure in the test scenario is significant, so it is likely that the difference between the techniques would not be as great is most real world settings.


Detecting Connection Imbalance in Oracle RAC

May 8, 2015

For Oracle RAC configurations that rely on spreading the load equally among instances, ensuring that inbound connections are balanced is quite important.

Since I was not able to find a suitable metric in the Oracle Enterprise Manager, I had to create one myself.

As I started thinking about it, some fundamental questions started popping up. How much difference in connection count should trigger an alert? Should I measure the percentage difference, the actual difference (number of sessions) , or something else?

Resisting the temptation to start coding convoluted logic, I reviewed what applied statistics has to offer and this is what I found – the Chi Square test !

Here is an example for homogeneity testing and here is one for independence testing.

The way I understand it, you can use that test to see if the connections are independently (uniformly) distributed across DB instances, or if there are some DB instances tend to get more or fewer connections than “expected”.

Another great thing about Chi Square test is that it is already implemented in the Oracle RDBMS.

The build-in Oracle function (STATS_CROSSTAB) can give us the value of Chi-squared (CHISQ_OBS) , the degree of freedom (CHISQ_DF), and the statistical significance (CHISQ_SIG).  What we are interested in is the statistical significance. A number less that 0.05 indicates that the data is likely not distributed uniformly.

Here is the query that can detect if a DB user prefers/avoids a DB instance:
—————————————————————————————–

SELECT COUNT(*) cnt
FROM
    (SELECT STATS_CROSSTAB(inst_id, username, 'CHISQ_SIG') p_value
    FROM gv$session
    )
WHERE p_value < 0.05

—————————————————————————————–

Detecting connection imbalance at client machine level is bit more tricky because each instance received a few connections from the server it is on.
That can be easily accounted for my excluding the servers that run the DBs:
—————————————————————————————–

SELECT COUNT (*) cnt
FROM
    (SELECT STATS_CROSSTAB(inst_id, machine, 'CHISQ_SIG') p_value
     FROM gv$session
     WHERE machine NOT LIKE '%dbp%.newsamerica.com'
     )
WHERE p_value < 0.05

—————————————————————————————–

These monitoring queries work without modification for any size RAC cluster. Adding or removing nodes is handled without issues, apart from a temporary imbalance that may come with adding nodes.


Confidence of Cardinality Estimates Optimization Techniques – When to Use?

March 31, 2015

Presenting on professional conferences frequently brings out important points that were not highlighted well enough.

RMOUG 2015 was no different.

After I presented my techniques for performance tuning by accounting for the confidence of cardinality estimates (slides 35-46 ), an attendee asked why my way of optimization was better than well-established optimization methods, such as tuning by cardinality feedback.

Well, that was a good question!

The short answer is that the methods I presented are better when Oracle gets low confidence cardinality estimates, i.e. it is forced to guess, because the selectivity varies greatly across executions and Oracle has no way to account for that.

Since the matter got s bit abstract, let’s go through an example:

Let’s have a column Name, that would contain the names of people. Let see what our options for dealing with predicate, such as

 Name like ‘%<Specific Name>%’

are?
This predicate can be very selective, if the name is something like… IOTZOV. That is,  predicate

 name like ‘%IOTZOV%’

would return very few records.

The very same predicate can be not that selective, if the name is something like SMITH. That is,  predicate

name like ‘%SMITH%’

could return a few records.

If there is no way for Oracle to figure out that one name (IOTZOV) is much more selective than another (SMITH) then the techniques I proposed for accounting for  the confidence of cardinality estimates are probably the best choice.

If there were a way for Oracle to figure out that one name (IOTZOV) is much more selective than another (SMITH), then Oracle would have probably gotten a good plan anyway.

If all names (IOTZOV, SMITH) have similar selectivity, but Oracle cannot figure it out for whatever reason, then we can use other techniques to feed Oracle the correct info. In this case, the other optimization techniques can lead to faster execution plans than the confidence of cardinality techniques I proposed.


RMOUG 2015

December 31, 2014

I am very excited to be selected to present at RMOUG 2015.

I got two presentations – “Managing Statistics of Volatile Tables in Oracle” on Wednesday and “Working with Confidence: How Sure Is the Oracle CBO about Its Cardinality Estimates, and Why Does It Matter?”  on Thursday. The presentations are updated with new 12c stuff, so they could be useful even if you have seen them before.

I’ll be there from Wednesday noon to Thursday afternoon. Hope to see you!


Update (Jan. 14 2015):

I just uploaded my presentations and white papers on RMOUG 2015 web site.

Volatile Tables Presentation:

Here are the latest package spec and package body  and the install instructions for JUST_STATS. Here is the code for the example.


Working with Confidence Presentation:

Here are the latest package spec and package body for XPLAN_CONFIDENCE. Here are the install instructions.


What to Do about Tools Hoarding Parallel Slaves in Oracle

November 26, 2014

Most GUI tools use cursors with relatively small fetch size (around 50) to retrieve data from Oracle. They open the cursor, fetch some data, show it and then wait on user input. All resources related to the connection and the open session are held while the tool waits on the user. While those resources are usually trivial for serial SELECT statements, they can be significant for parallel SELECT statements.

Each parallel statement gets assigned a number of parallel slaves and those slaves are not freed until their respective cursor is closed, regardless of the amount of work the slaves do. Since there are limited number of parallel slaves available in an instance (PARALLEL_MAX_SERVERS init.ora parameter) the hoarding of parallel slaves can prevent future statements to be executed in parallel, severely impacting the performance of those statements.

This following blog post describes the situation quite well:
http://structureddata.org/2012/02/29/pitfalls-of-using-parallel-execution-with-sql-developer/

Since this behavior is not a bug, i.e. there is never going to be a fix, we need to find a way to manage it.

One solution is to disable parallelism for all sessions coming from GUI tools that use cursors and therefore could cause this problem. This is a radical step that would deprive the users from running anything in parallel.

The second option is to educate the users of the problems associated with open cursors and ask them to close all cursor as soon as possible. This approach is ideal when executed diligently, but in reality not all users are compliant.

The approach I would like to propose is to allow parallelism for all, but monitor those who do not close their open cursors. Here is the query that I use to monitor:

select count(*) from 
  (
      select * 
      from gv$px_session px_QC   
      where px_QC.qcinst_id IS NULL
      minus
      select * from gv$px_session px_QC   
      where px_QC.qcinst_id IS NULL
      and  exists
            (select * 
             from gv$px_session  px_Slaves , gv$session sess
             where px_QC.qcsid = px_Slaves.qcsid
             and px_Slaves.sid = sess.sid
             and (sess.wait_class = 'Idle'
                 or ( sess.seconds_in_wait < 600
                      and sess.wait_class = 'Idle'
                     )
                 )
             )
   )

This query returns zero if the parallel slaves are actively used and greater than zero if there is a set of parallel slaves that have been idle for 600 second. This query can be used to get the offending session and “talk” with the end user. It could be integrated with OEM using Metric Extensions or it could be part of a monitoring script that kills the offending sessions. The possibilities are endless.


“Orphaned” LOB Segments

October 31, 2014

Recently, after doing reorganization in Oracle 11.2.0.2.0 DB, I came upon a LOB segment that does not link to a LOB.
That is, there was an entry in USER_SEGMENTS and USER_OBJECTS, but there was no entry in USER_TABLES, USER_LOBS and USER_INDEXES.
It turned out that the in the recycle bin (USER_RECYCLEBIN).  It appears that the DROP command did not “remove” all references to the dropped object.
The moral of the story is that if something is missing, look for it in the trash (the recycle bin, that is). Some things never change…


A Patch for JUST_STATS Package

August 11, 2014

An alert user recently notified my about a problem with the JUST_STATS package. It appears that it does not work properly with PARTITIONs. So, click here to download the first patch.
Please note that you are free to review and modify the code of the package.


When Oracle would Choose an Adaptive Execution Plan (part 1)

July 2, 2014

Understanding when a useful feature, such as Adaptive Execution Plans, would fire is of crucial importance for the stability of any DB system.

There are a few documents explaining how this feature works, including some that dig deep into the details:
http://kerryosborne.oracle-guy.com/2013/11/12c-adaptive-optimization-part-1/
http://www.dbi-services.com/index.php/blog/entry/oracle-12c-adaptive-plan-inflexion-point
http://scn.sap.com/community/oracle/blog/2013/09/24/oracle-db-optimizer-part-vii–looking-under-the-hood-of-adaptive-query-optimization-adaptive-plans-oracle-12c

However, I was not able to find a comprehensive technical document about when this feature fires.
My previous post included some general thoughts about issue. The simple explanations there, while plausible in general, do not fully match the messy reality.

I this post I will try to identify when a SQL plan goes from non-Adaptive (NL/HJ) to Adaptive and back. Once I have the “switching” point, I’ll review the 10053 trace just before and just after the switch.
Tables T1 andT2 was created this script. T2 has 1 million records and T1 has one.
In a loop, I insert a single record into T1 and run this query:

select    t2.id ,

          t1.str,

          t2.other
from

          t1,

          t2
where
          t1.id = t2.id

and       t1.num = 5

and       <UNIQUE NUMBER> = <UNIQUE NUMBER > ( insure that there is no plan reuse)

Initially the SQL uses Nested Loops, but after inserting 5 or 6 records, it switched to an Adaptive Execution Plan. We have a “switch” point!!!


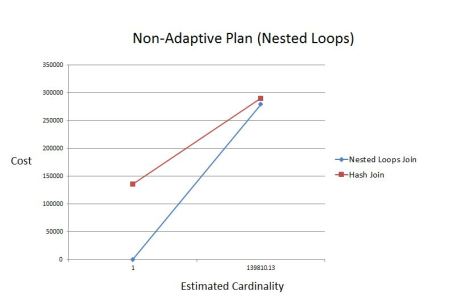
The 10053 trace for the Non-Adaptive (NL) plan looks like this:

—————————————————————————————

Searching for inflection point (join #1) between 1.00 and 139810.13

AP: Computing costs for inflection point at min value 1.00

..

DP: Costing Nested Loops Join for inflection point at card 1.00

 NL Join : Cost: 5.00  Resp: 5.00  Degree: 1

..

DP: Costing Hash Join for inflection point at card 1.00

….

Hash join: Resc: 135782.55  Resp: 135782.55  [multiMatchCost=0.00]

….
DP: Costing Nested Loops Join for inflection point at card 139810.13

….

 NL Join : Cost: 279679.55  Resp: 279679.55  Degree: 1

..

P: Costing Hash Join for inflection point at card 139810.13

….
Hash join: Resc: 290527.15  Resp: 290527.15  [multiMatchCost=0.00]

DP: Found point of inflection for NLJ vs. HJ: card = -1.00
——————————————————————————————————–


The 10053 trace for the Adaptive plan looks like this:

——————————————————————————————————–

Searching for inflection point (join #1) between 1.00 and 155344.59 

+++++

DP: Costing Nested Loops Join for inflection point at card 1.00


NL Join : Cost: 5.00  Resp: 5.00  Degree: 1

….

DP: Costing Hash Join for inflection point at card 1.00

Hash join: Resc: 135782.55  Resp: 135782.55  [multiMatchCost=0.00]

+++++

DP: Costing Nested Loops Join for inflection point at card 155344.59

….

NL Join : Cost: 310755.84  Resp: 310755.84  Degree: 1

….

DP: Costing Hash Join for inflection point at card 155344.59
..

 Hash join: Resc: 290536.21  Resp: 290536.21  [multiMatchCost=0.00]

+++++

DP: Costing Nested Loops Join for inflection point at card 77672.80

NL Join : Cost: 155380.42  Resp: 155380.42  Degree: 1

DP: Costing Hash Join for inflection point at card 77672.80

Hash join: Resc: 290392.89  Resp: 290392.89  [multiMatchCost=0.00]
+++++

DP: Costing Nested Loops Join for inflection point at card 116508.69

NL Join : Cost: 233068.13  Resp: 233068.13  Degree: 1

DP: Costing Hash Join for inflection point at card 116508.69

Hash join: Resc: 290464.05  Resp: 290464.05  [multiMatchCost=0.00]
+++++

DP: Costing Nested Loops Join for inflection point at card 135926.64

NL Join : Cost: 271911.98  Resp: 271911.98  Degree: 1

DP: Costing Hash Join for inflection point at card 135926.64

 Hash join: Resc: 290500.13  Resp: 290500.13  [multiMatchCost=0.00]

+++++

(skiped iterations)

DP: Found point of inflection for NLJ vs. HJ: card = 145228.51

——————————————————————————————————–

The relationship between cardinality and cost for the non-adaptive plan (NL) is shown here:
NonAdaptivePlan

The respective graphic for adaptive plan is here:

AdaptivePlan

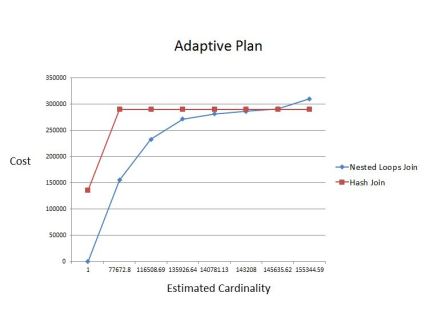
In this situation, Oracle went with an adaptive plan because it was able to find an inflection point.

One important factor that determines whether an inflection point is found is the range the inflection point is searched in. That is, the main reason the CBO could not find an inflection point for the non-adaptive plan is that the range was from 1 to 139810. If the range was wider, it would have probably found an inflection point.

That means that in some cases the decision to use adaptive plans depends on what cardinality range it would use when searching for the inflection point.

It should also be noted that there are situations where Oracle would decide not to use adaptive plans without going through the motions of looking for an inflection point.

All in all, lots of additional research is needed to answer those questions…


An Oracle Distributed Query CBO Bug Finally Fixed (After 7 Years)

April 9, 2014

Optimizing distributed queries in Oracle is inherently more difficult. The CBO not only has to account for the additional resources related with distributed processing in Oracle, such as networking, but also has to get reliable table/column statistics for the remote objects.

It is well documented that Oracle has(d) trouble passing information about histograms for distributed queries( http://jonathanlewis.wordpress.com/2013/08/19/distributed-queries-3/ ).

In addition, Oracle was not able to pass selectivity information for “IS NULL/NOT NULL” filters via a DB link, even though the value of records with NULL is already written to NUM_NULLS column in DBA_TAB_COLUMNS…
As a result of this bug, every query that has IS NULL against a remote table ended up with cardinality of 1, even if there were many NULL records in the table.

PLAN_TABLE_OUTPUT
SQL_ID  djpaw3d54d5uq, child number 0
-------------------------------------
select 
       * 
from 
       tab1@db_link_loop a , dual  
where 
       a.num_nullable is null

Plan hash value: 3027949496

-------------------------------------------------------------------------------------------
| Id  | Operation          | Name | Rows  | Bytes | Cost (%CPU)| Time     | Inst   |IN-OUT|
-------------------------------------------------------------------------------------------
|   0 | SELECT STATEMENT   |      |       |       |     8 (100)|          |        |      |
|   1 |  NESTED LOOPS      |      |     1 |    11 |     8   (0)| 00:00:01 |        |      |
|   2 |   TABLE ACCESS FULL| DUAL |     1 |     2 |     2   (0)| 00:00:01 |        |      |
|   3 |   REMOTE           | TAB1 |     1 |     9 |     6   (0)| 00:00:01 | DB_LI~ | R->S |
-------------------------------------------------------------------------------------------

Remote SQL Information (identified by operation id):
----------------------------------------------------

   3 - SELECT ID,NUM,NUM_NULLABLE FROM TAB1 A 
WHERE NUM_NULLABLE IS  NULL (accessing 'DB_LINK_LOOP')

The behavior was due to MOS Bug 5702977 Wrong cardinality estimation for “is NULL” predicate on a remote table

Fortunatly, the bug is fixed in 12c and 11.2.0.4. A patch is available for 11.2.0.3 on certain platforms.